Test a waiting room
Follow this tutorial to ensure your Waiting Room queues and admits users as expected.
Before you begin
Before you start this tutorial, ensure you have:
- Fulfilled all the prerequisites
- Previously created a waiting room
- Updated the sample script to ensure your waiting room captures when a “simulated user” enters and is released from your waiting room (if you customized the design of your waiting room)
1. Download sample script
First, download the sample script from GitHub.
This script simulates users entering a waiting room. It divides traffic into two phases (Phase 1 and Phase 2) so you can test wait times as load increases and then decreases.
2. Run sample script
Once you have downloaded the script, run it with the following command-line arguments:
-n <num_secs_p1>: Number of seconds to send requests during phase 1-m <num_secs_p2>: Number of seconds to send requests during phase 2, which is fixed at 1 request per second-s <sleep_time_p1>: Amount of time to sleep between requests during phase 1 (fractional time accepted, such as.3)-o <results>: File to store the per-session statisticsURL: Endpoint protected by a Cloudflare Waiting Room
Example script run
simulate_requests -s .1 -n 60 -m 60 -o results https://example.com/tickets/1234/
Output
Sending 600 requests to https://example.com/tickets/1234/ at a rate of 10.00 per second. Or 600 per minute.

Wed 10 Mar 2021 10:48:59 AM CST
...................................................................................................................a.aa.aa.a..
Wed 10 Mar 2021 10:50:00 AM CST

Now doing 1 request per second for 60 seconds.
babdacdbeacbc.abbedcbacbddaccdaeebbcabedccaebddbcacedb.cadcedbacabcbeacbbabdcdbaaebddcbcabeeadbcbacadedabbaacd.dabecbabbdecbdaegehgjkfjifggfihjhghhfhifkfj.gjighhgfiihgdihkffiejgjjigggjkijkk
Wed 10 Mar 2021 10:51:01 AM CST

Waiting for jobs to finish
hgiibjjjjcjhjgbgiggikihhjcihhhhlkkknmjjmmjnnonokklmmklnmonmlonoompollplommpmmpolpoqmponngoonqjimqmgjmmnkmogmqoiqpoqolmmqonghpppjpiopoopqomkqnnqgnmqnnppopnqrpptqtrrrrpsrqtrusrtsvusvsrrvstttrvsvsvussrtuwtvrtsvtrvsqunrmtrrrsqnqptvsuqturwsvstnmwuwtusvsvwsouspqtuuvsvrvwtwssvqtuuuwspvoxyzyyvwvzwxyxyyAzyyzABxBBzyxyxxBBACzzyxAvwsyzxztzvuvtCACyvxstuutvCw
Wed 10 Mar 2021 10:54:22 AM CST
As the script runs, it will output characters with each character representing:
- A user session that advanced past the waiting room
- The amount of time the user spent in the waiting room:
- 0 seconds:
. - 10 seconds:
a - 20 seconds:
b - 30 seconds:
c
… - 260 seconds:
A - 270 seconds:
B
… - 530 seconds:
0 - 540 seconds:
1
… - Greater than 620 seconds:
!
- 0 seconds:
3. Analyze results
Once the script finishes running, it creates a CSV file with the following fields:
Fields in CSV file
- job: The fixed string will either be main for phase 1 or{' '} post for phase 2
- status: Status of the last response of the session:
-
0: curl command received an HTTP status code of
200 - 1: curl command did not receive any HTTP status codes, which typically means the curl command itself failed
-
2: curl command received an HTTP status code of something other than
200 - wait_time: Number of seconds the user waited in the waiting room
- wr_cnt_before: Number of users in the waiting room when the session first started
- wr_cnt_after: Number of users in the waiting room when the session made it past the waiting room
- start_time: Time when the session first started (in UNIX epoch seconds)
- end_time: Time when the session made it past the waiting room (in UNIX epoch seconds)
To visualize your results, open your CSV file within a spreadsheet application. For example, here is a basic chart that shows the amount of time a user waited verses the time they first tried to get to the web service:
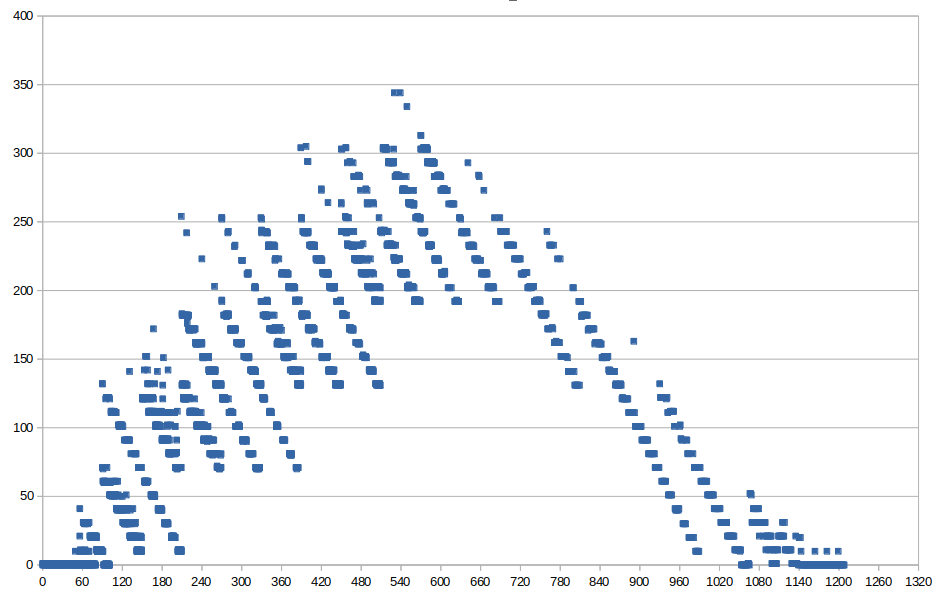
In this example, you can clearly see when the script entered the second phase — with a reduced rate of new users per second — leading to decreased wait times.
4. Adjust waiting room (optional)
Based on the results of your test, you may want to adjust the settings of your waiting room.