Profiling Workers
For long-running or complex Workers, wrangler inspect (beta) will help you understand which parts of your code require the most time to execute.
As part of the Workers platform’s integration with Chrome Developer Tools, you can use wrangler dev --inspect to get a CPU profile of your Worker.
wrangler inspect is only available in Wrangler v1.19.3 or later. Check what version you have before continuing. If you need to update Wrangler, refer to the guide on
upgrading Wrangler
.
Profiling an example project
Create a new Workers project with the wrangler generate command:
$ wrangler generate my-worker
Open the index.js file in your project’s directory and replace the content with:
addEventListener('fetch', event => {
  event.respondWith(handleRequest(event.request));
});

const timer = ms => new Promise(res => setTimeout(res, ms));

async function sleepBetween() {
  let result = 0;

  for (let i = 0; i < 100; i++) {
    result += i;
    await timer(100);
  }

  return result;
}

async function handleRequest(request) {
  await sleepBetween();

  return new Response('Hello worker!', {
    headers: { 'content-type': 'text/plain' },
  });
}
This is a basic example where the Worker’s request handler calls an async function sleepBetween. The function iterates from 0 to 100, but after each iteration, it calls timer(100), which will sleep for 100 milliseconds. This function will simulate slow code, which you can use to test out the profiler.
Profiling our Worker
With your index.js file updated and saved, go to your terminal and run wrangler dev --inspect. You will see additional instructions for configuring Chrome DevTools.
$ wrangler dev --inspect
💁  watching "./"
🕵️  Open chrome://inspect, click 'Configure', and add localhost:9230
👂  Listening on http://127.0.0.1:8787
Open a new tab in Chrome and enter chrome://inspect in the Chrome address bar to open Chrome’s DevTools. Select Configure… and add localhost:9230. The Wrangler inspect process will then show up under Remote Target.
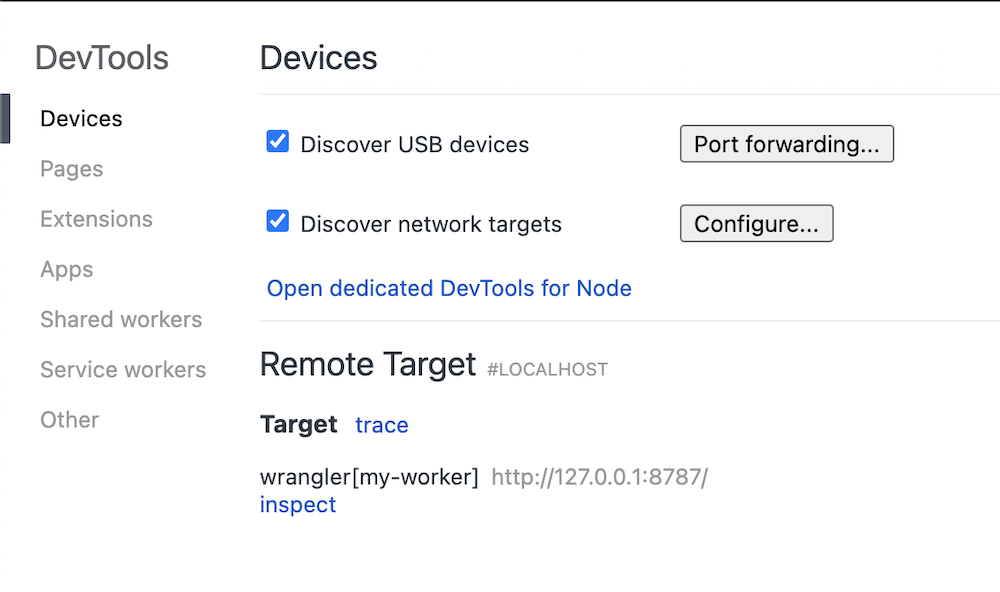
Select inspect to open DevTools.
Capturing a CPU profile
With the DevTools open, select the Profile tab > Start. Open a new tab with your Worker running locally http://127.0.0.1:8787. Visiting this address will invoke the Worker again and allow DevTools to capture execution information. When it finishes loading, go back to the DevTools window and select Stop.
There are three ways to view the CPU profiling data:
- Tree - a top-down view of all functions called. Starting with top-level functions and nesting subsequent calls under each one.
- Heavy - a bottom-up view of all functions called. Starting with the final functions in the stack and nesting parent calls under each one.
- Chart - a flame chart that will show all function calls and how much time was spent in each function execution.
To find slow functions, enter the Chart view and search for the last long function in a stack.
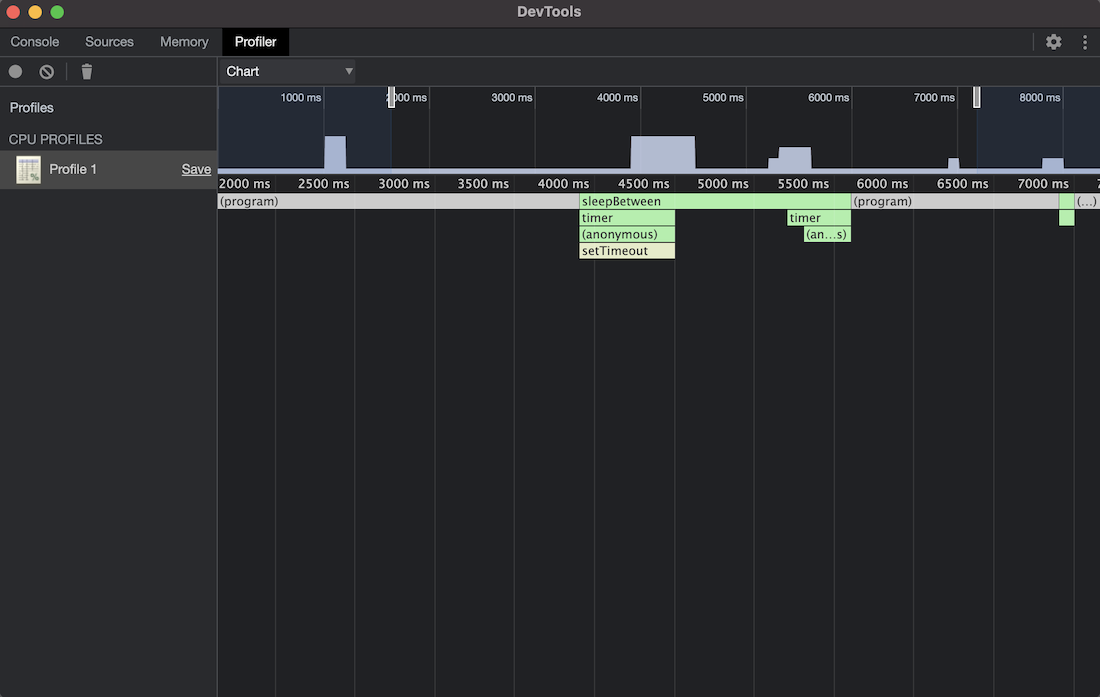
A function’s total runtime is determined by the runtime of all the functions it calls. You will want to find the function with the longest Self Time, or the last big runtime before it finishes or splits into smaller calls. For more information on using the DevTools, refer to the official Chrome documentation.
In the example image above, sleepBetween has the longest runtime.
You can also arrive at this conclusion through the Heavy view, which allows you to sort by Self Time or Total Time. When you sort by Self Time and ignore any items in parenthesis, you can identify the functions with the longest execution time.