Datadog
This tutorial explains how to analyze Cloudflare metrics using the Cloudflare Integration tile for Datadog.
Overview
Before viewing the Cloudflare dashboard in Datadog, note that this integration:
- Is available to all Cloudflare customer plans (Free, Pro, Business and Enterprise)
- Is based on the Cloudflare Analytics API
- Provides Cloudflare web traffic and DNS metrics only
- Does not feature data coming from request logs stored in Cloudflare Logs
Task 1 - Install the Cloudflare App
To install the Cloudflare App for Datadog:
-
Log in to Datadog.
-
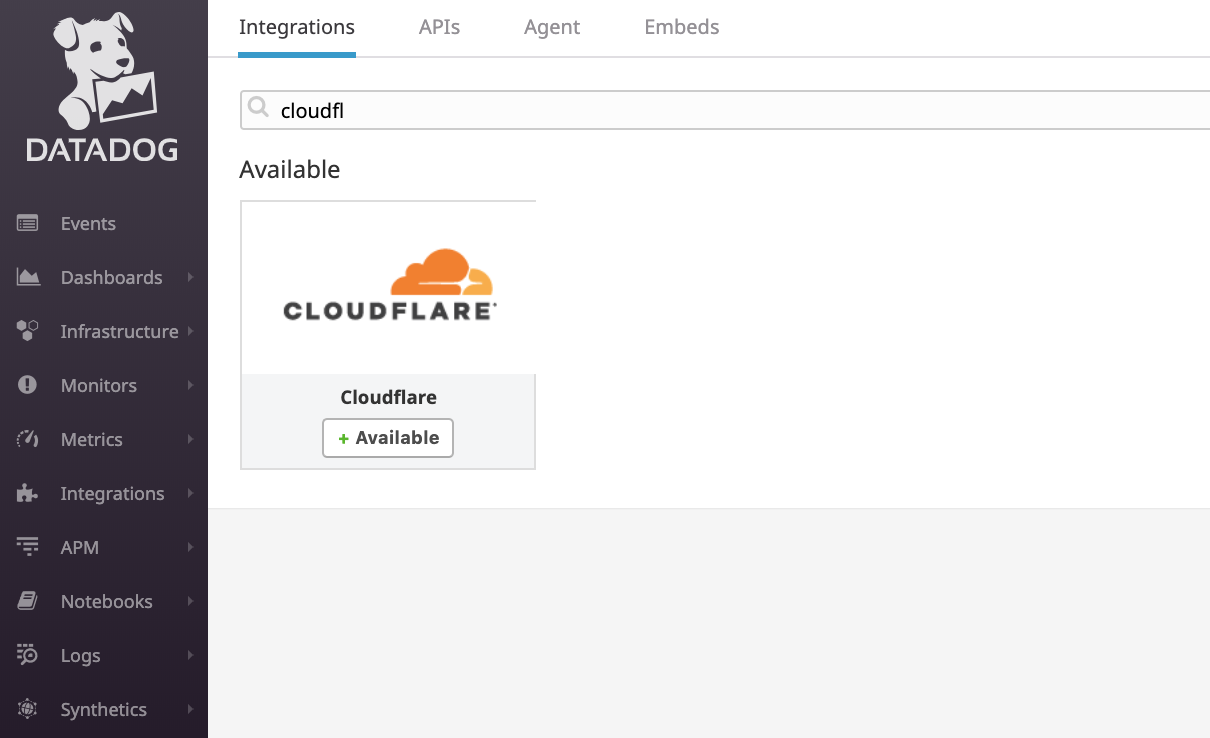
Click the Integrations tab.
-
In the search box, start typing Cloudflare. The app tile should appear below the search box.

-
Click the Cloudflare tile to begin the installation.
-
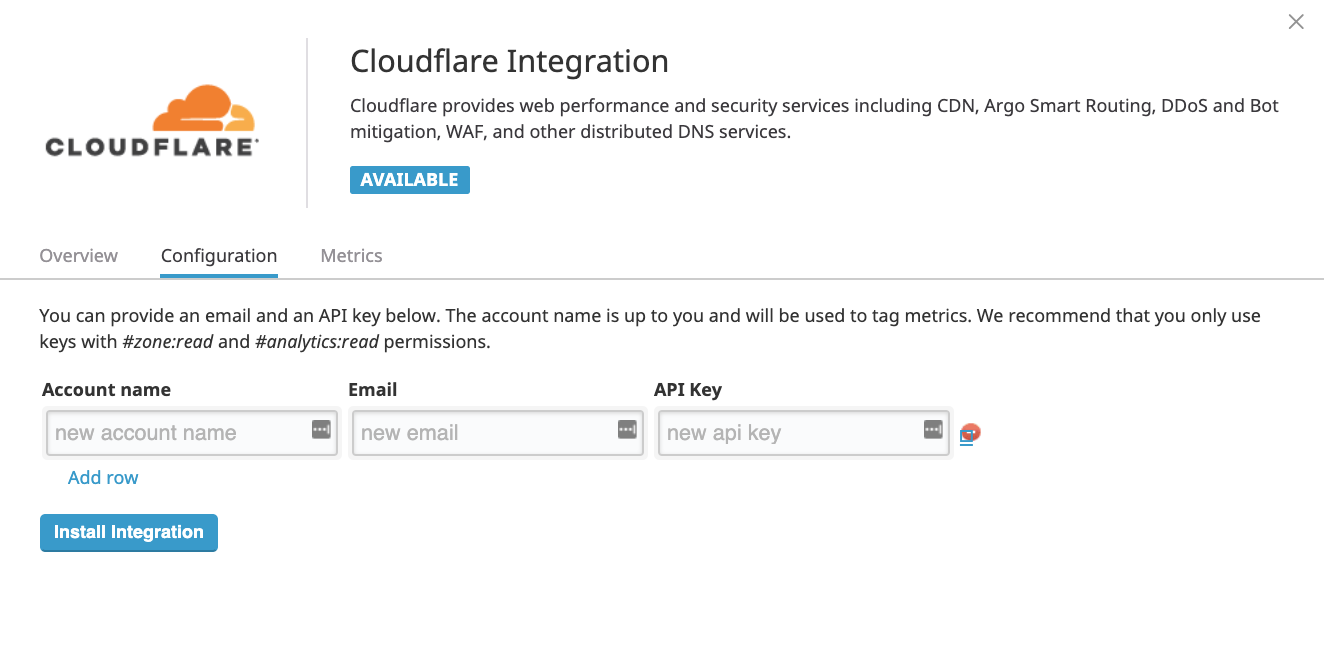
Next, click Configuration and then complete the following:
-
Account name: (Optional) This can be any value. It has not impact on the site data pulled from Cloudflare.
-
Email: This value helps keep your account safe. We recommend creating a dedicated Cloudflare user for analytics with the Analytics role (read-only). Note that the Analytics role is available to Enterprise customers only.
-
API Key: Enter your Cloudflare Global API key.
-
-
Click Install Integration.

The Cloudflare App for Datadog should be installed now and you can view the dashboard.
Task 2 - View the dashboard
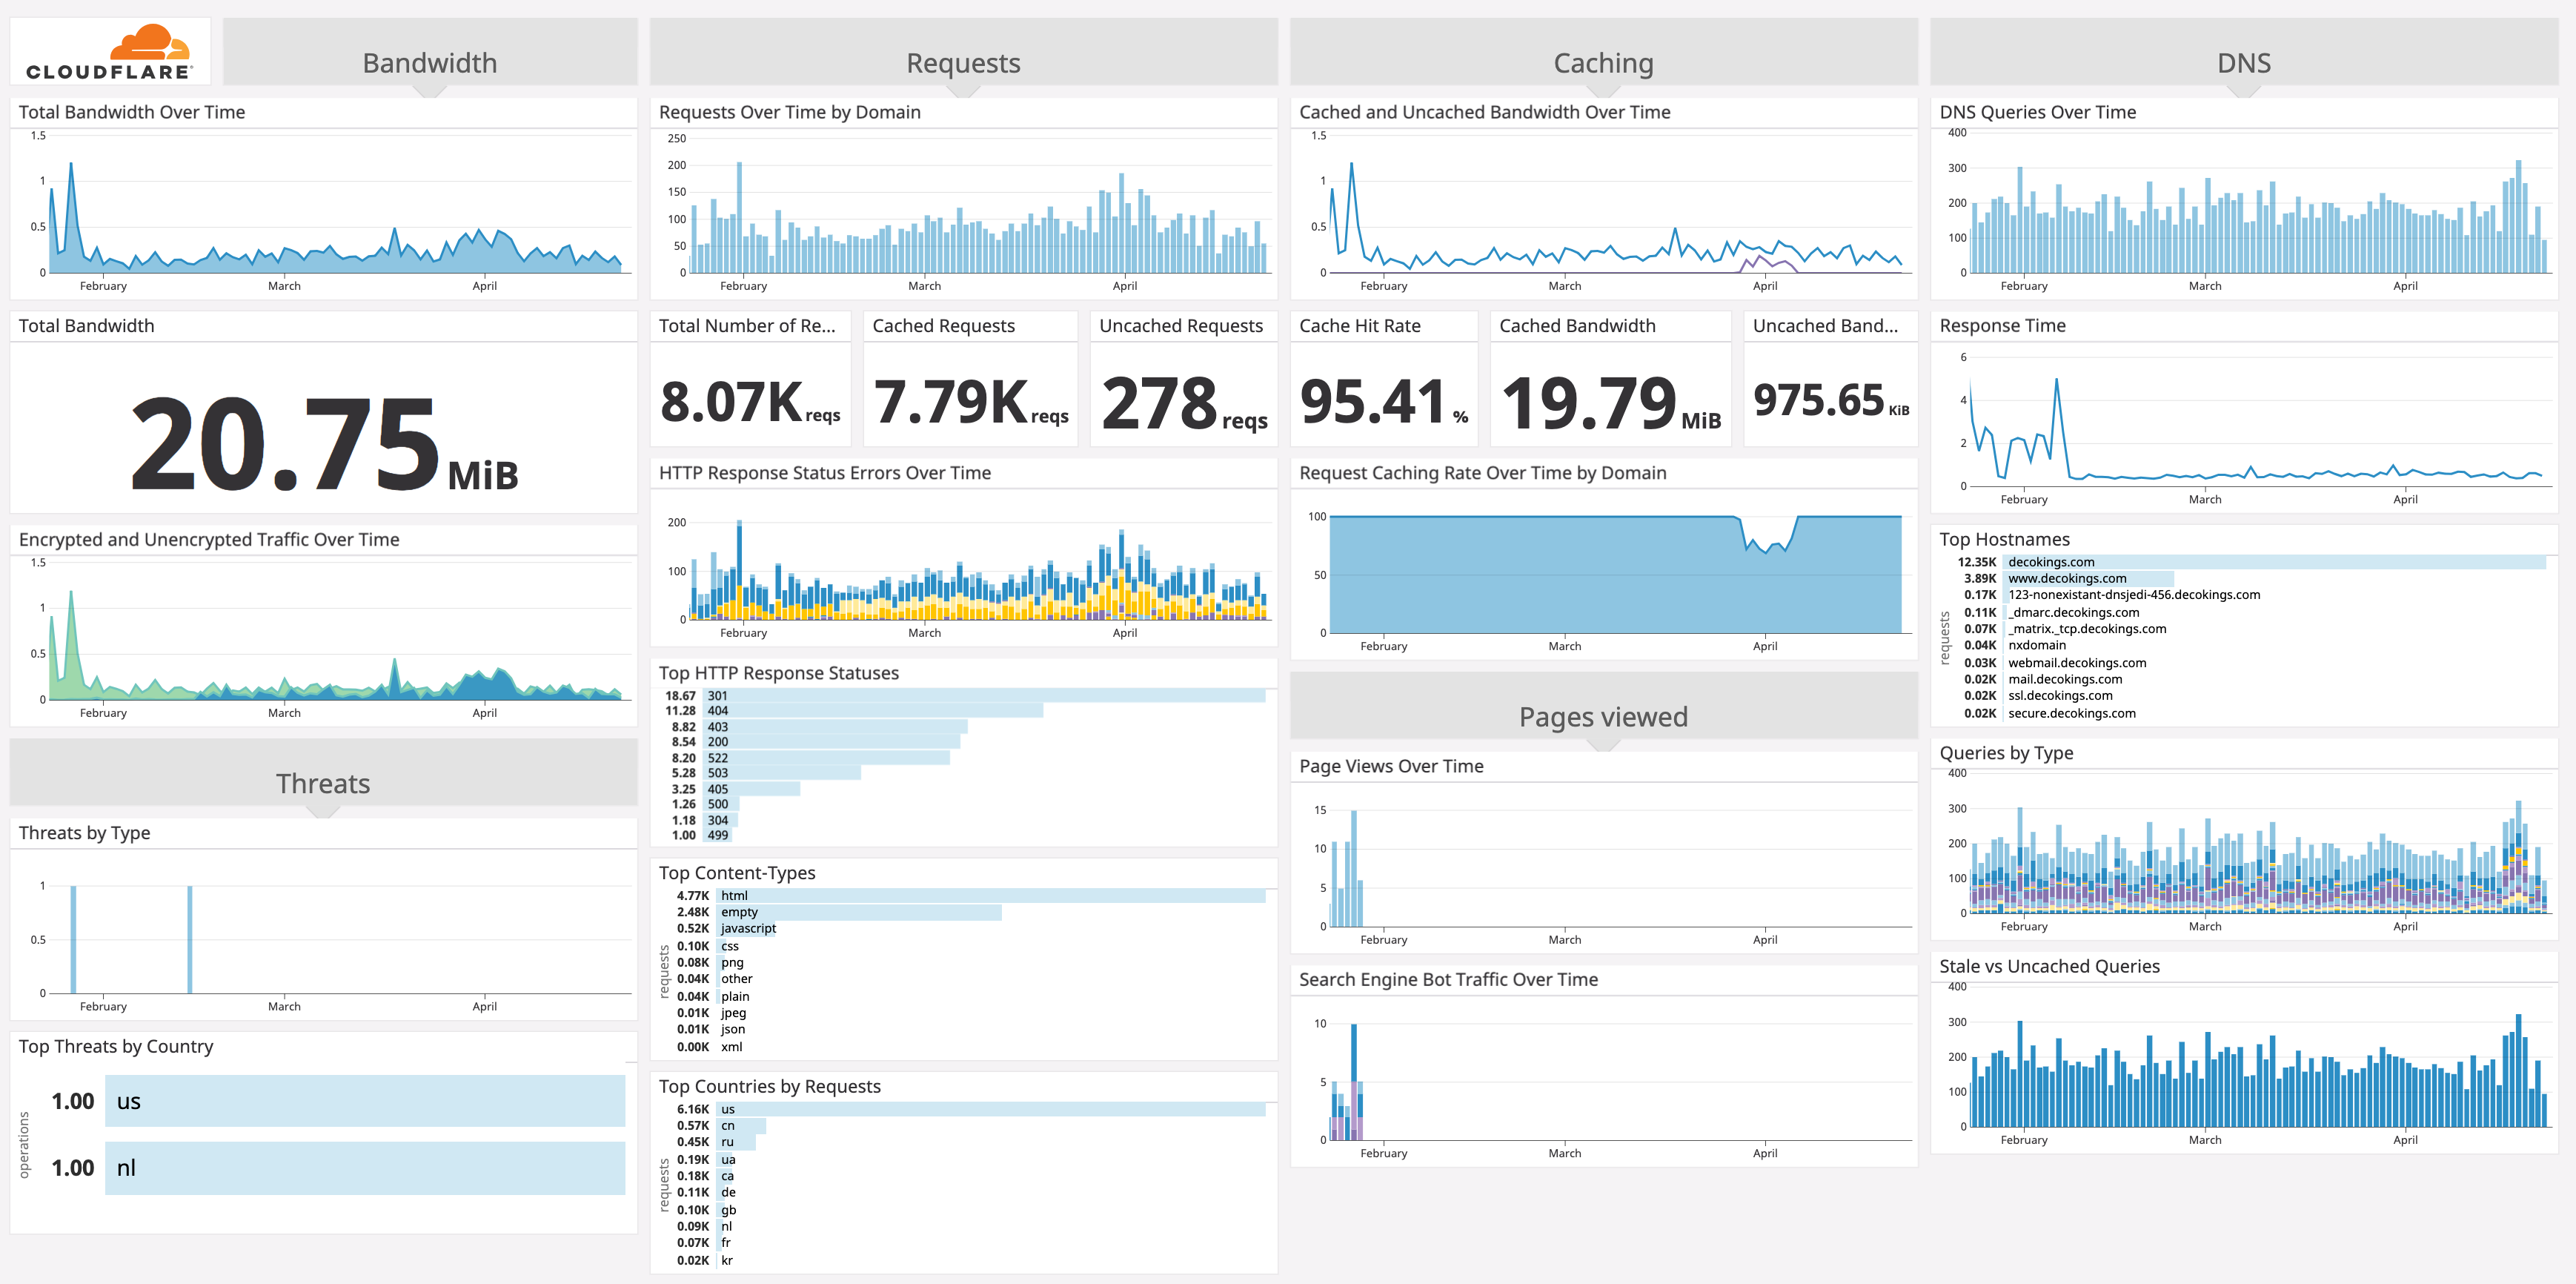
By default, the dashboard displays metrics for all sites in your Cloudflare account. Use the dashboard filters see metrics for a specific domain.
The dashboard displays the following metrics:
- Threats (threats by type, threats by country)
- Requests (total requests, cached requests, uncached requests, top countries by request, requests by IP class, top content types)
- Bandwidth (total bandwidth, encrypted and unencrypted traffic cached bandwidth, uncached bandwidth)
- Caching (Cache hit rate, request caching rate over time)
- HTTP response status errors
- Page views
- Search Engine Bot Traffic
- DNS (DNS queries, response time, top hostnames, queries by type, stale vs. uncached queries)
